PSplot
tip
Up to date source of the firmware can be found here
Preperation
- Make sure that you have Python 3.10 installed
- Download the latest software here
pip install pipenvpipenv installpipenv shellpython psplot.py
Interface
The interface is divided up in 3 sections:
Data in/out
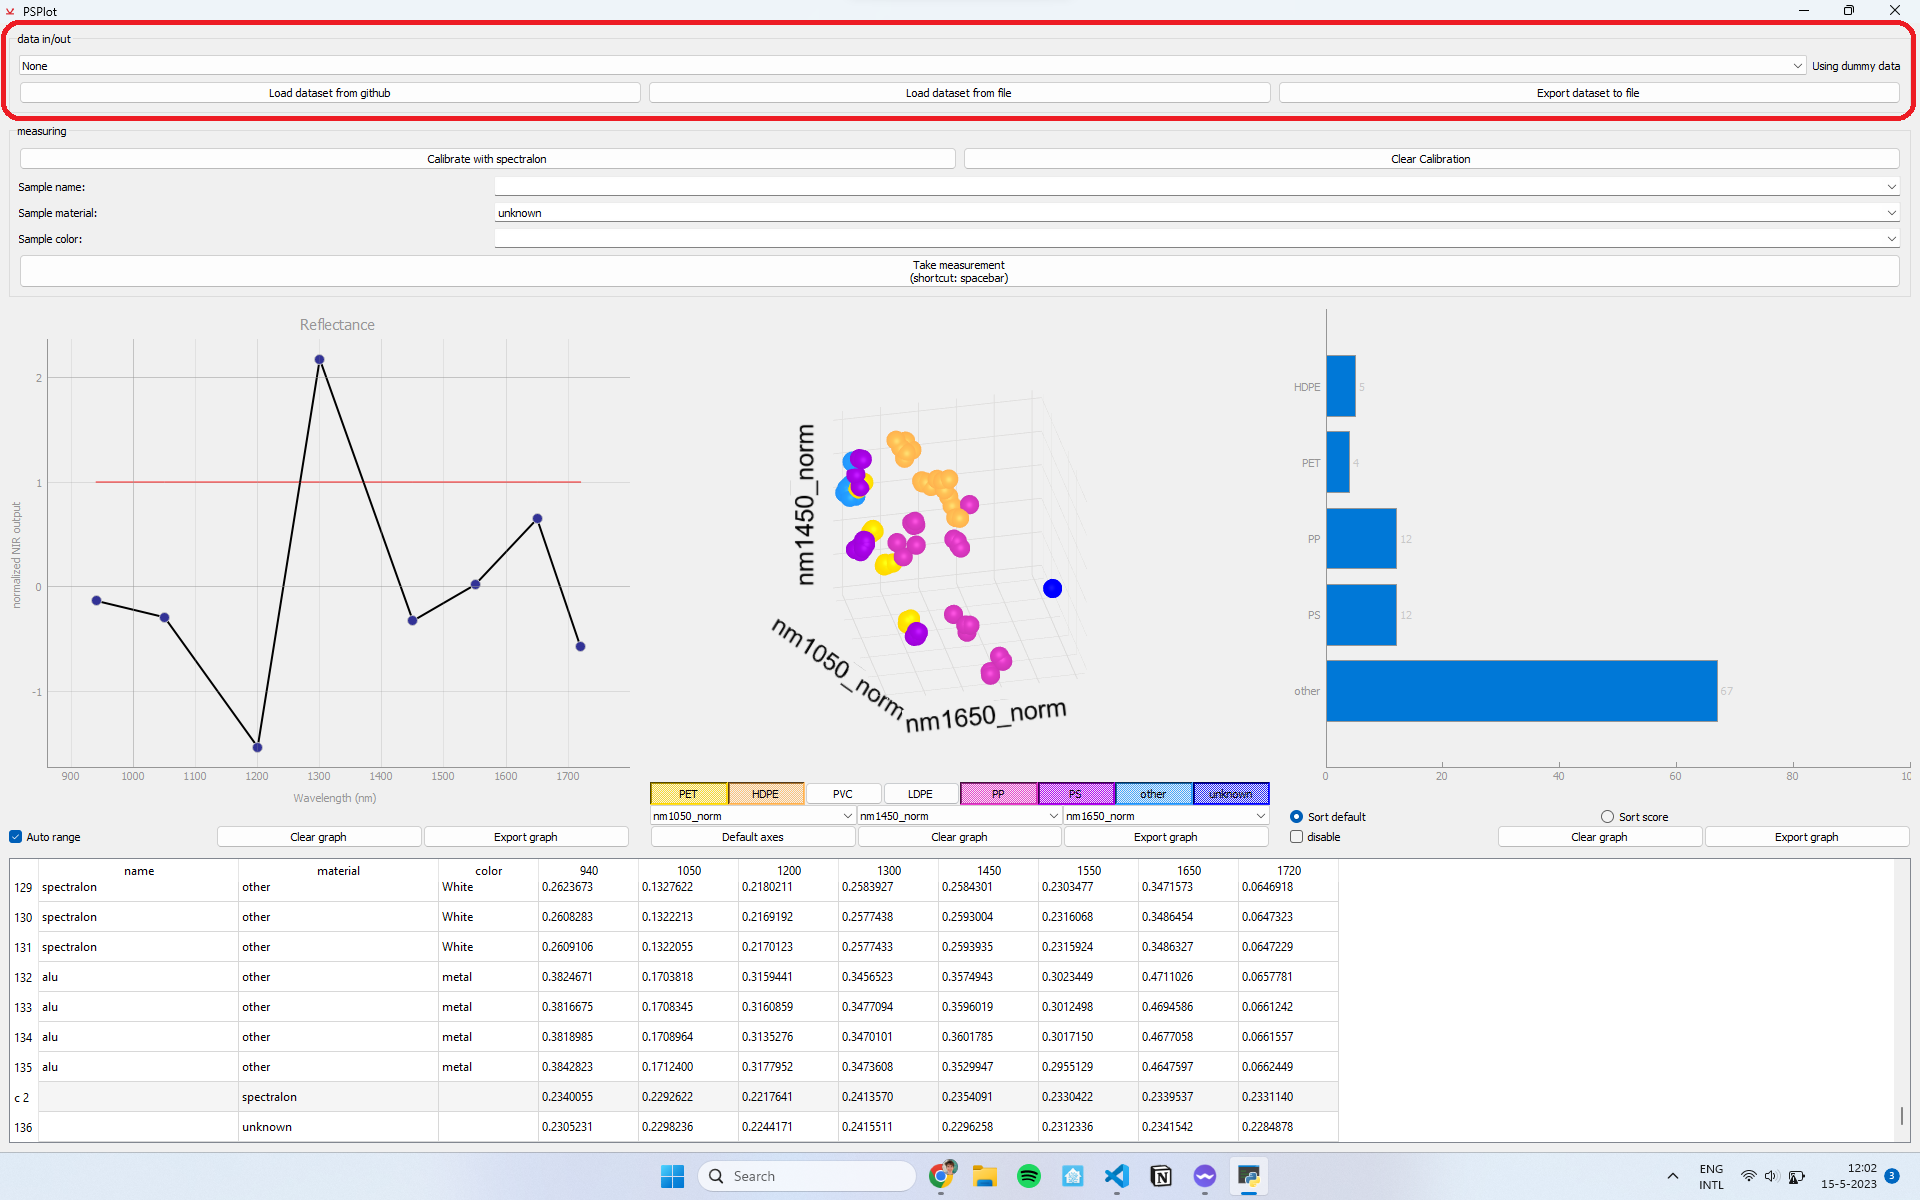
Here you can select your developement board, if no COM port is available/selected it will use dummy data (to help the developers!) You can also import or export data to load previous dataset or to export your data once you are done.
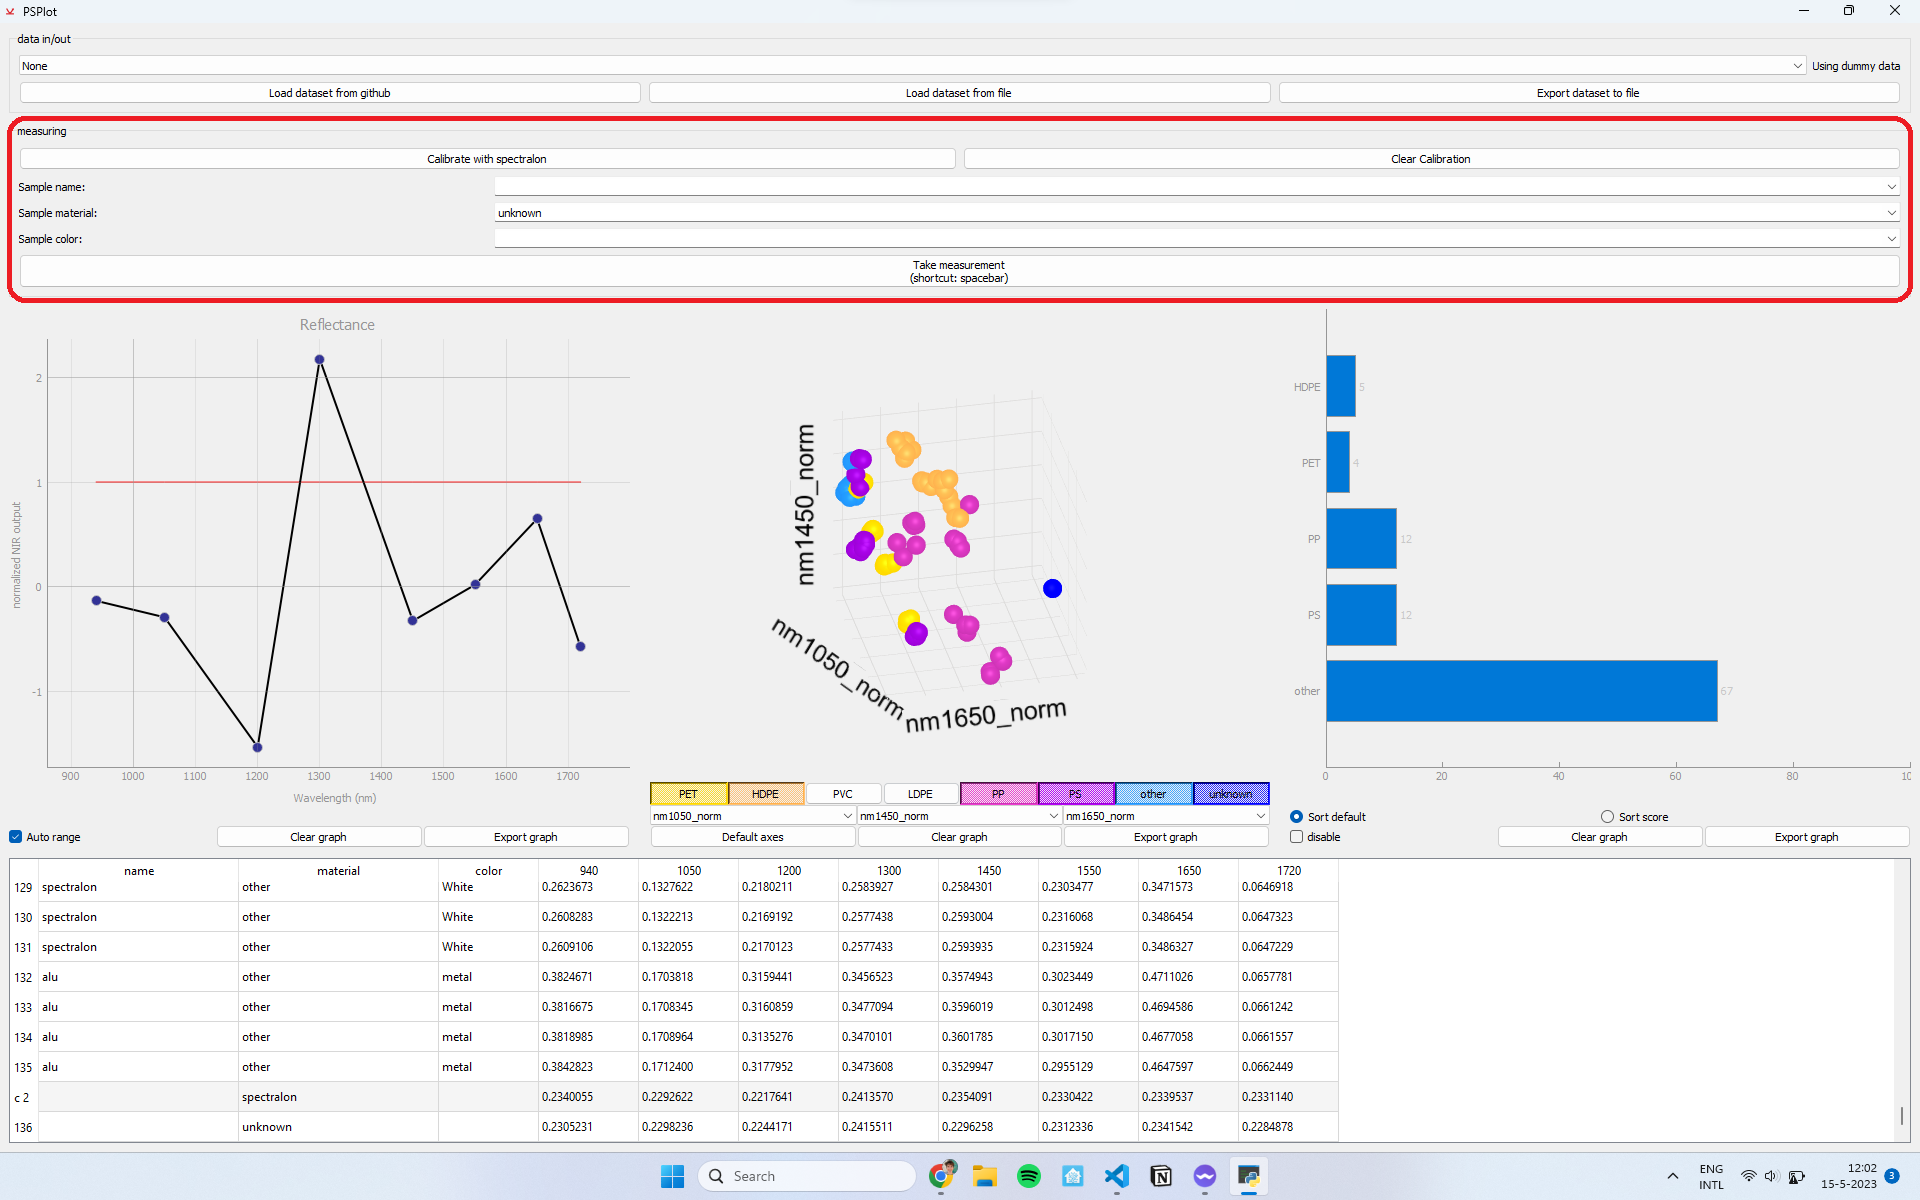
Measuring
In this section you can:
- calibrate with reference material
- fill in details about (un)known sample
- take a measurement
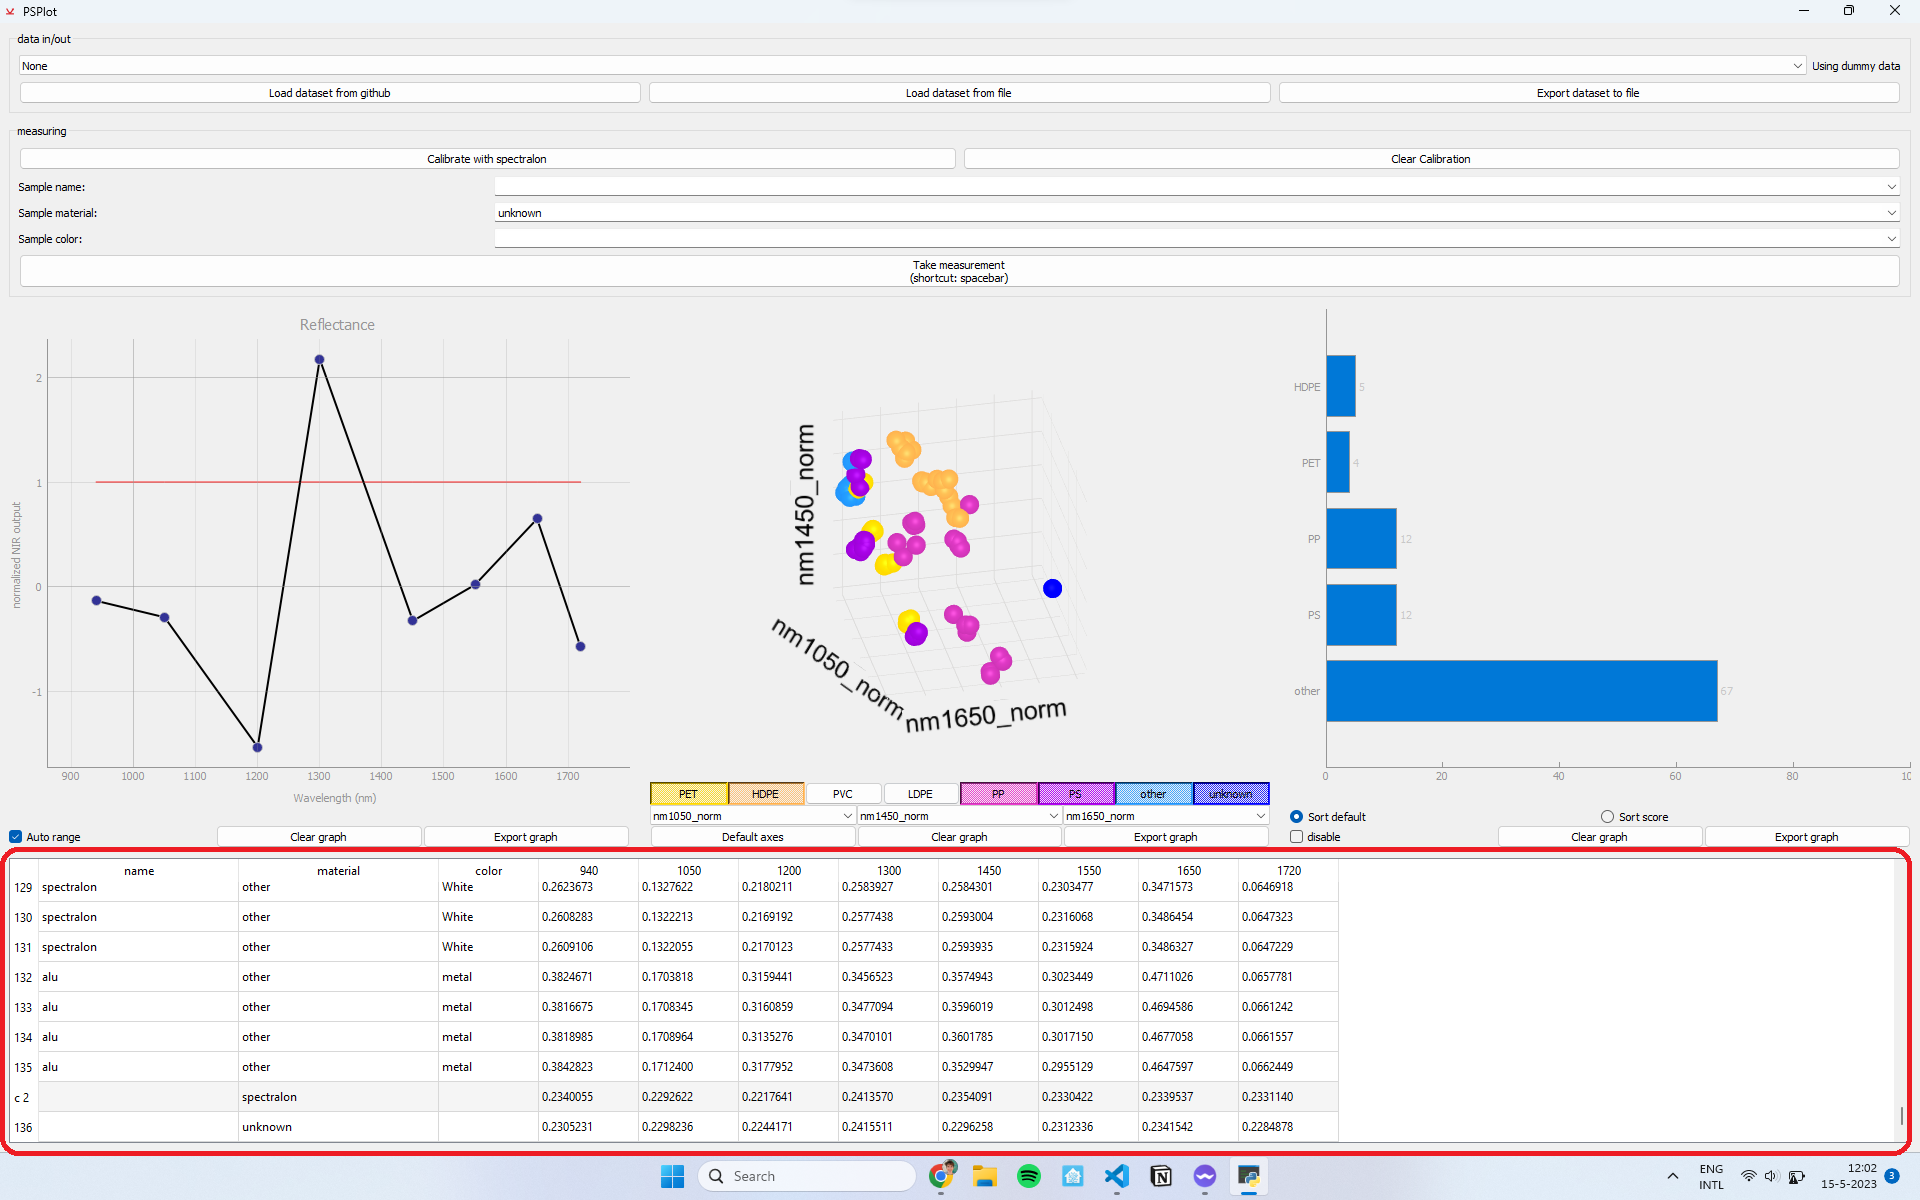
Data visualisation
The last section shows the visualisation of the measurement. It has four sections
- 2D spectrum graph, this shows the measurement from the sample, with the reference measurement as an ideal straight line and with the SNV applied. It shows the last 3 measurements

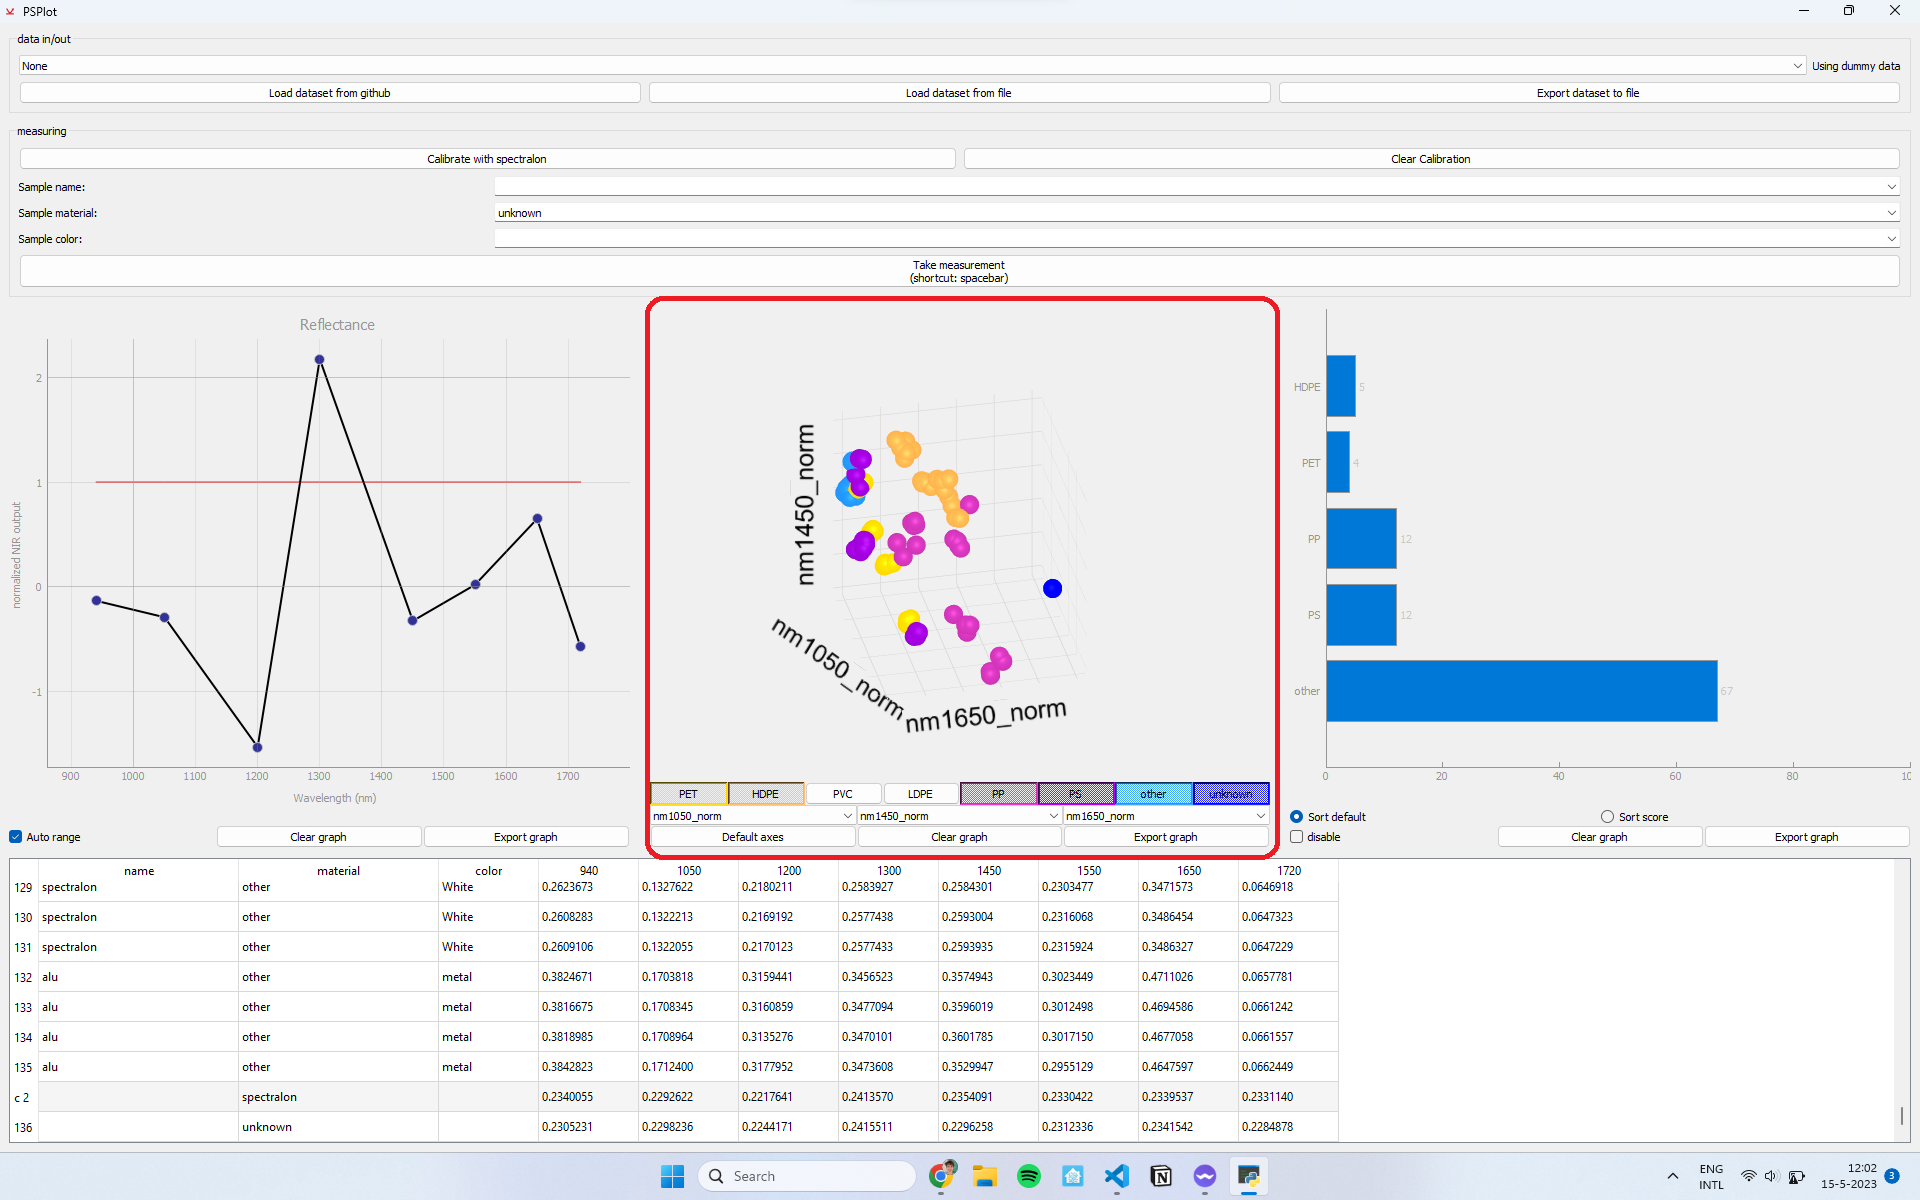
- 3D scatter plot, this shows a 3D plot with the previous measurements. The colors are based on the "Sample Material" input. It defaults to the axis that we think are the most interesting, but with the drop down menus you can play around to see what works for you.
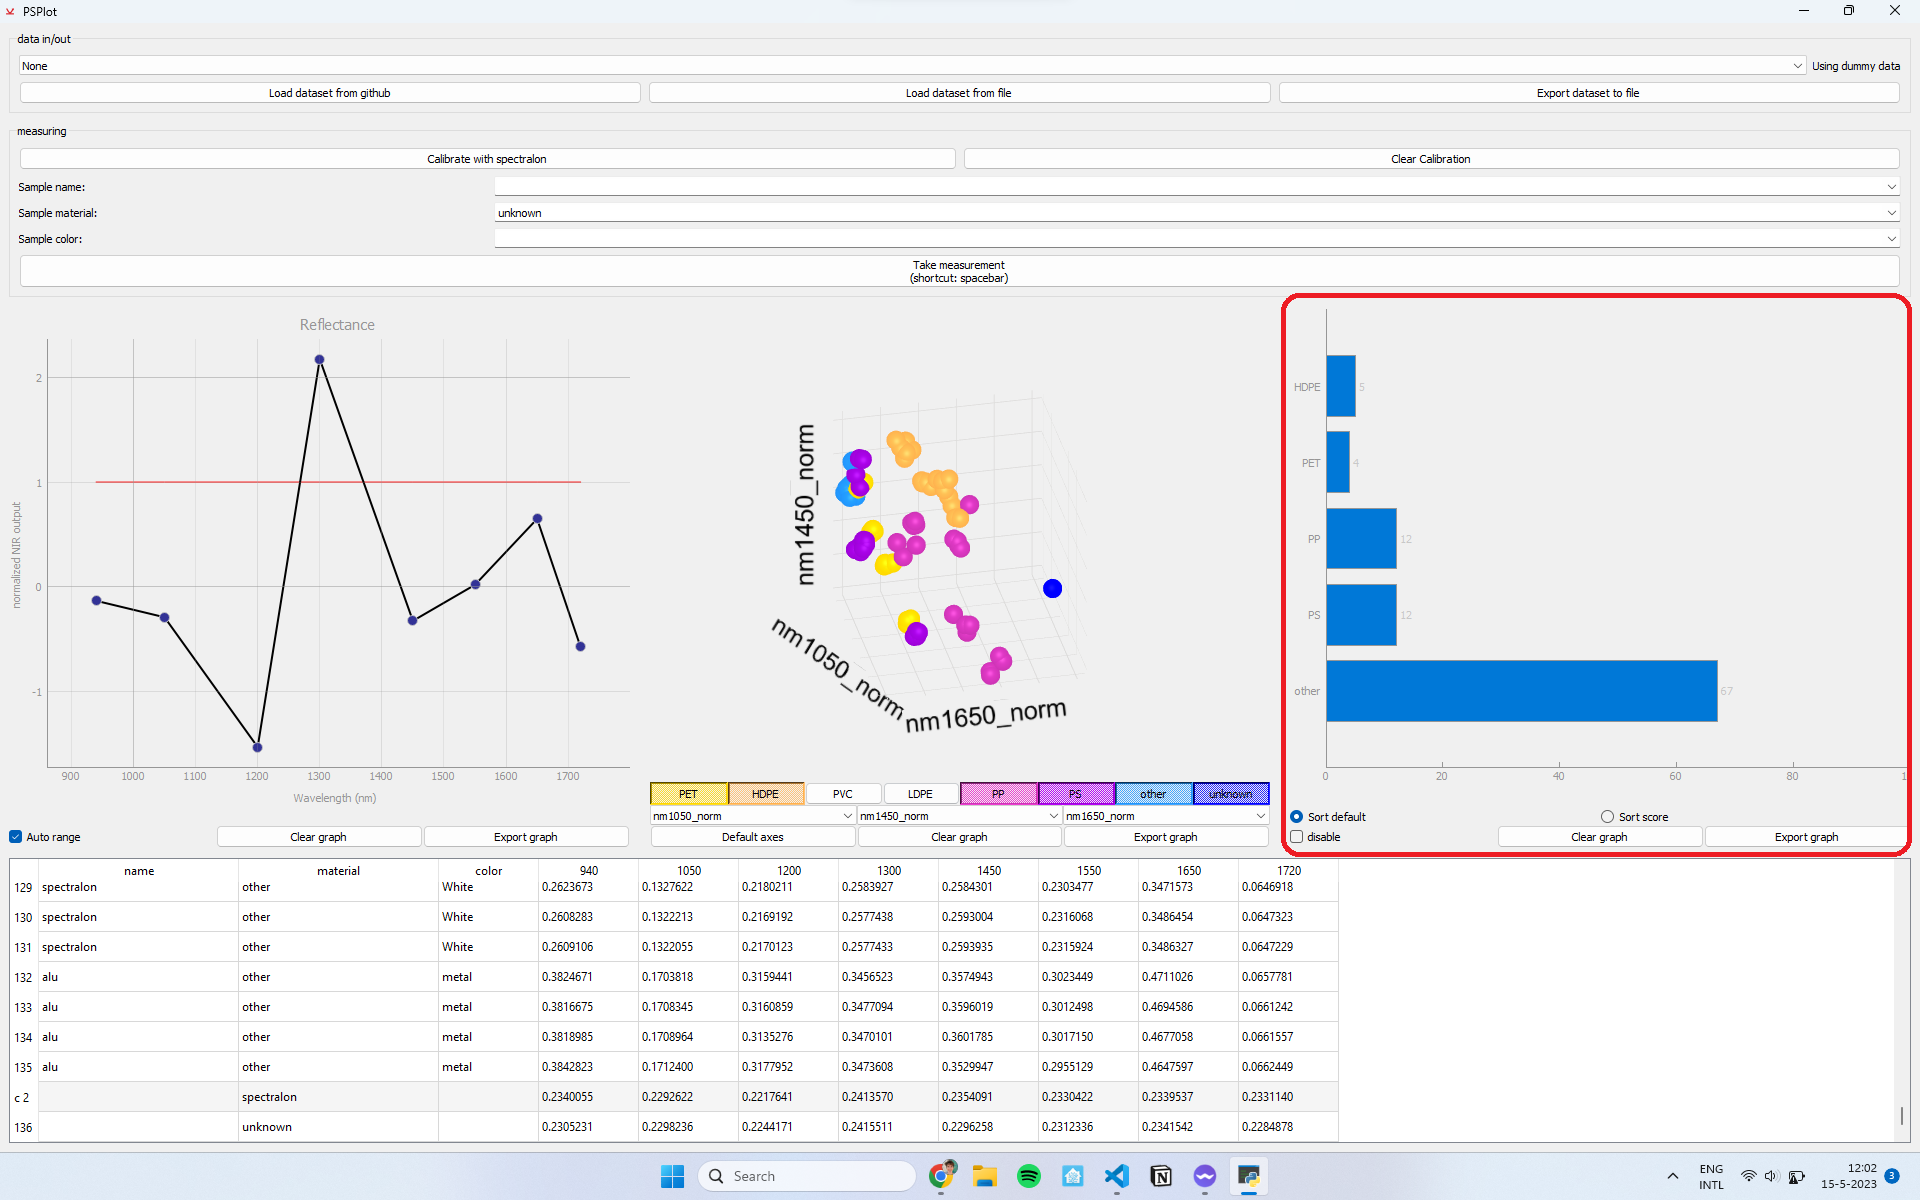
-
WARNING: this is a first experiment! It is a bar chart, that shows what the computer thinks is the most likely type of plastic, this is at the moment only an experiment for HDPE, PET, PP and PS
- Table with the raw measurement values. In this table you can also edit the material of a measurement after taking the measurement by editing one of cells.
Contributing
Feel free to improve, modify and contribute to this project. You can find the lastest open source code here Github Repo.